
If 15% Excess Mortality and 15% Decreased Birthrates Continue, Everybody Would Be Dead in 20 Years
If 15% Excess Mortality and 15% Decreased Birthrates Continue, Everybody Would Be Dead in 20 Years
That Can't Be Right


A picture of a picture taken by me in Las Vegas in circa 2000. From left to right my father, Aunt Sharon, Uncle Bruce, Grandma and Grandpa. May they all rest in peace.
Sometimes I come across something that I find so thought provoking that I need quite a bit of time to absorb it. This was one of those articles.
Start with this chart:
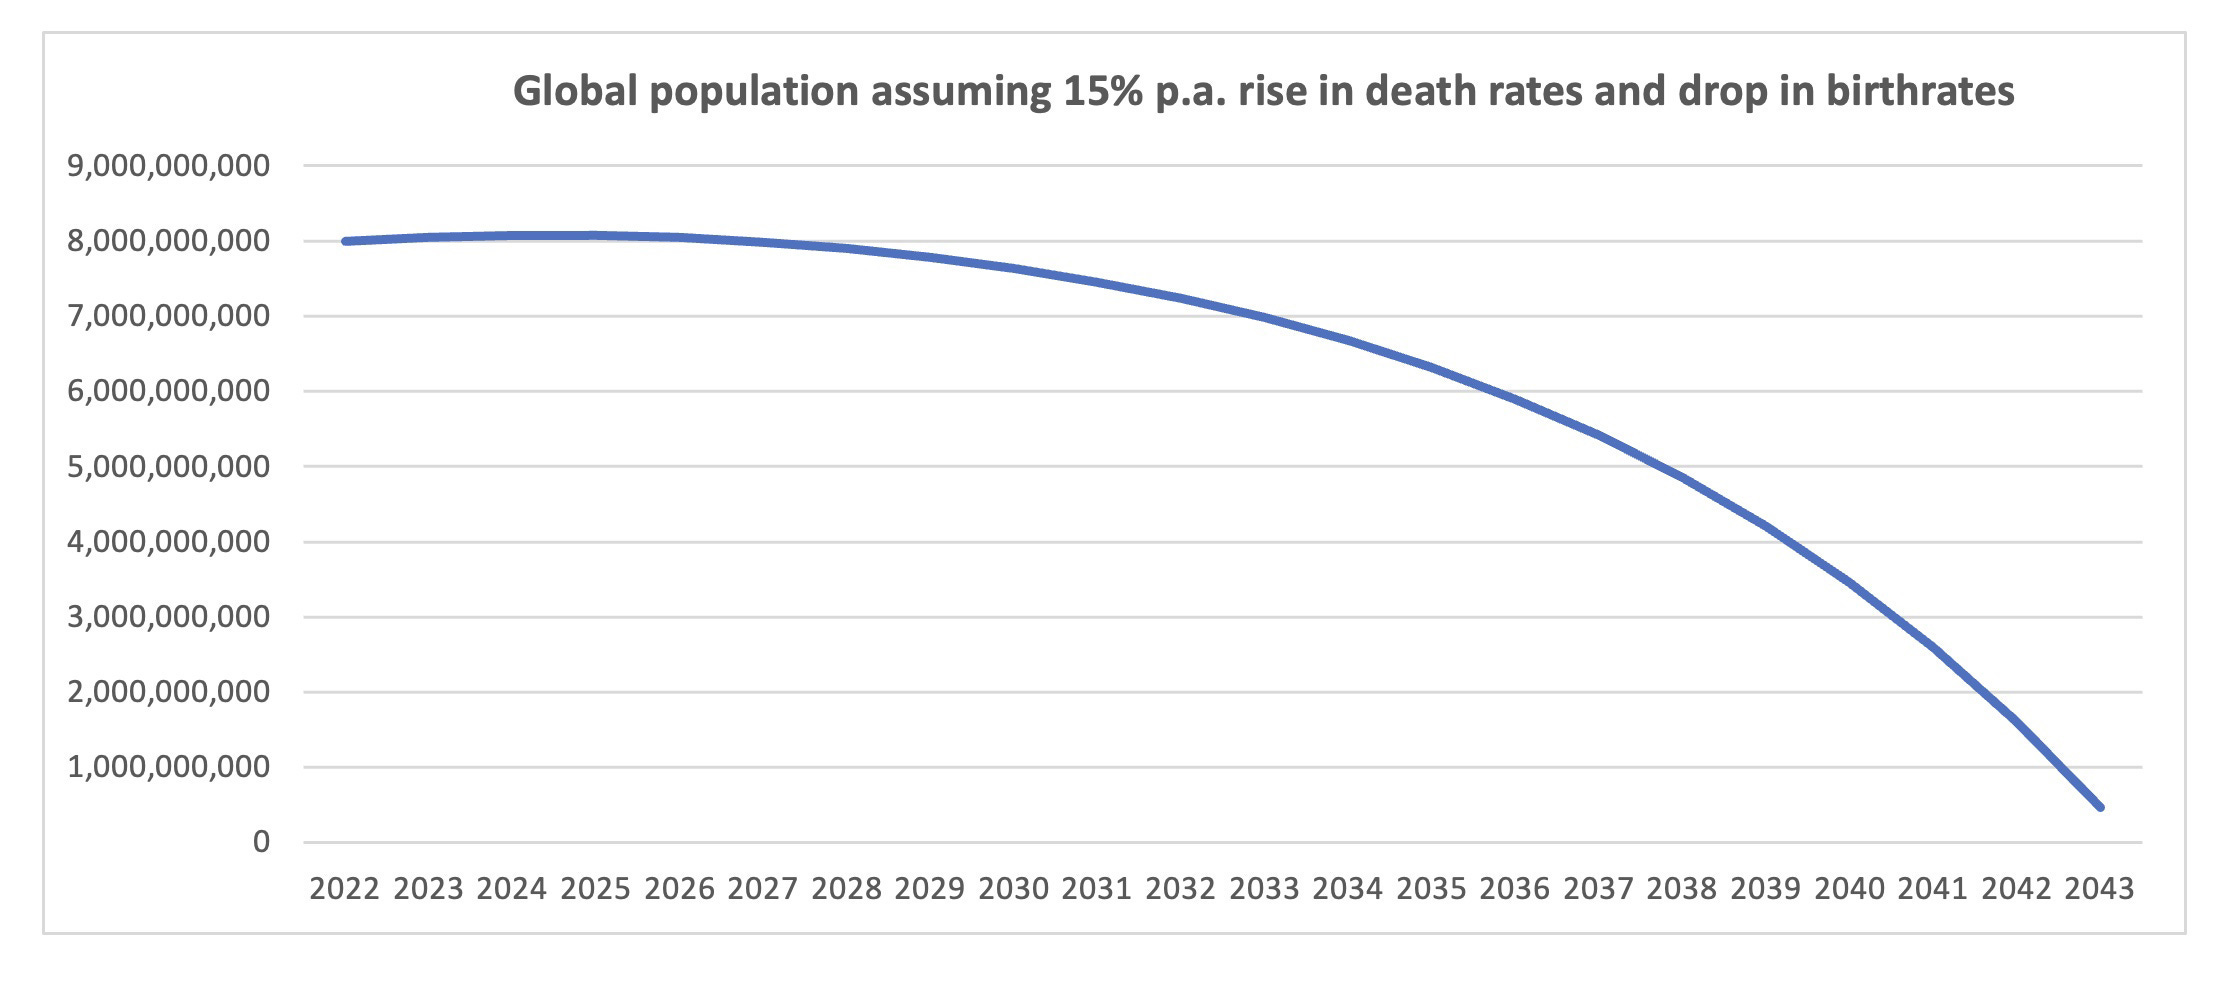
That’s not a chart of the predicted rise in global population. That’s the total population, which under Jan Wellmann’s calculations would apparently be 0 by 2043, which is less than 20 years away. I would like, God willing, to be alive in 20 years. Even more importantly I certainly want my daughters to be alive in 20 years, when they would be 29 and 35, respectively. There’s certainly a chance under normal circumstances that my mother would be alive in 20 years, and perhaps a few of our younger cats and dogs might be too. It’s not that far away.

Mr. Jan put this out on Valentine’s Day with the most obtuse title possible. It’s sort of like corporate types putting out a boring business update on December 24 which is conveniently hiding a total bankruptcy and restructuring, say. Obviously I was super curious how he came to his calculations, but at the least it makes you start thinking beyond the whole “The Earth has too many people so who cares if a few more die and a few less are born?” type of thinking, am I right?
I’ve always viewed demographic charts as a way of calming down my more sensationalist fears. Too many excess deaths for a few months or even a year or two create a pull forward effect and lead to less deaths than expected in the next era. This creates a wavy effect where demographic charts of overall mortality usually trend around a cumulative baseline of 0, neither above nor below expected deaths when extended out several years. In most countries there was a slow climb of overall life expectancy.
Births follow a similar trend but it usually carries out over the course of more years, and the pattern is towards a slow lessening of the number of children since about 1950 or so. Baby booms are followed by birth dearths once overwhelmed parents realize that they don’t want quite as many children around. This happened in the 1970’s in America, for example.

A few decades out the baby boom becomes a baby bump as the large cohort of babies began growing up and having babies of their own. Meanwhile, slowly and steadily, the number of births go down. The only dramatic spikes in either direction are usually during periods of war or famine, after which births spike up in dramatic fashion. Life finds a way. People tire of burying their dead and dream of a brighter future.
These demographic charts were all so normal and so calming to me. Maybe it was my mother’s obsession with the Rapture after my baby sister died, but do you want to know what I didn’t want to look at? Anything that indicated the end of the world.
Like charts that break trendlines in really bad ways:
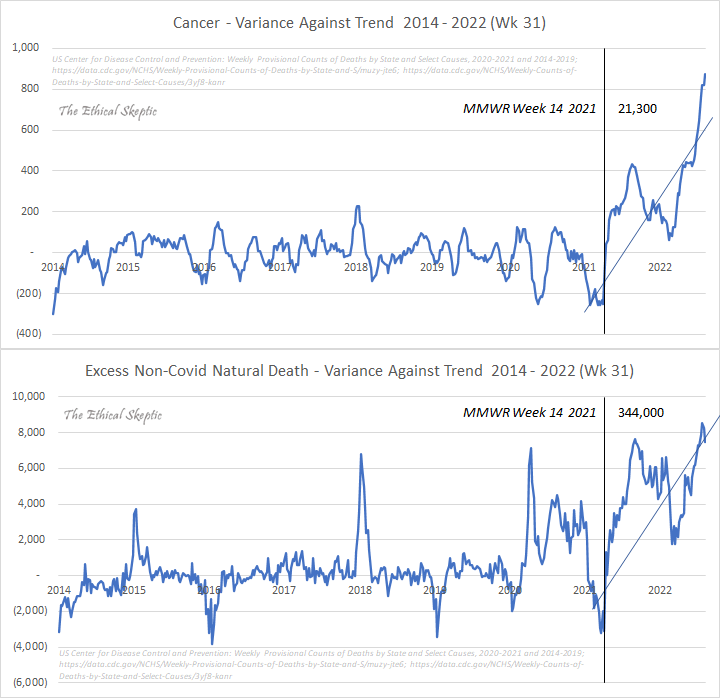
So is Mr. Jan’s original calculation of 15% excess mortality and 15% decreased births a bad input? I’m not really sure. What’s terrifying is that nobody knows when the excess mortality or the decreased births end, which is precisely what is so unsettling about most of these charts. They are global, or at least coming from virtually every country with any size which is thought to keep fairly accurate records. Anyone who is really looking at the data and knows what they are looking at will say the same thing: “I don’t want to be right about this.”
In honor of that I have moved into a stage of understanding those remaining apologists for the vax regime. This is all terrifying and I don’t want you to die either. I don’t want to die also. I don’t want my children to die anytime in the near future. Perhaps you are correct to call it business as usual. Thank you and have a wonderful day and hopefully a nice life.
But I can’t help wondering is it really okay? It’s bad.
So in honor of Ron Unz I decided to run the cumulative excess mortality for every country that began with the letter U. Two countries, those being Uganda and UAE, did not have this information in Our World in Data. Unfortunately it only goes back to the beginning of the pandemic, which underscores how extreme and elevated cumulative excess mortality really is. Some of these countries, but not all, experienced excess mortality in 2020 also. At least half should be dipping towards baseline and even violently adjusting downwards to below 0%. They are not:
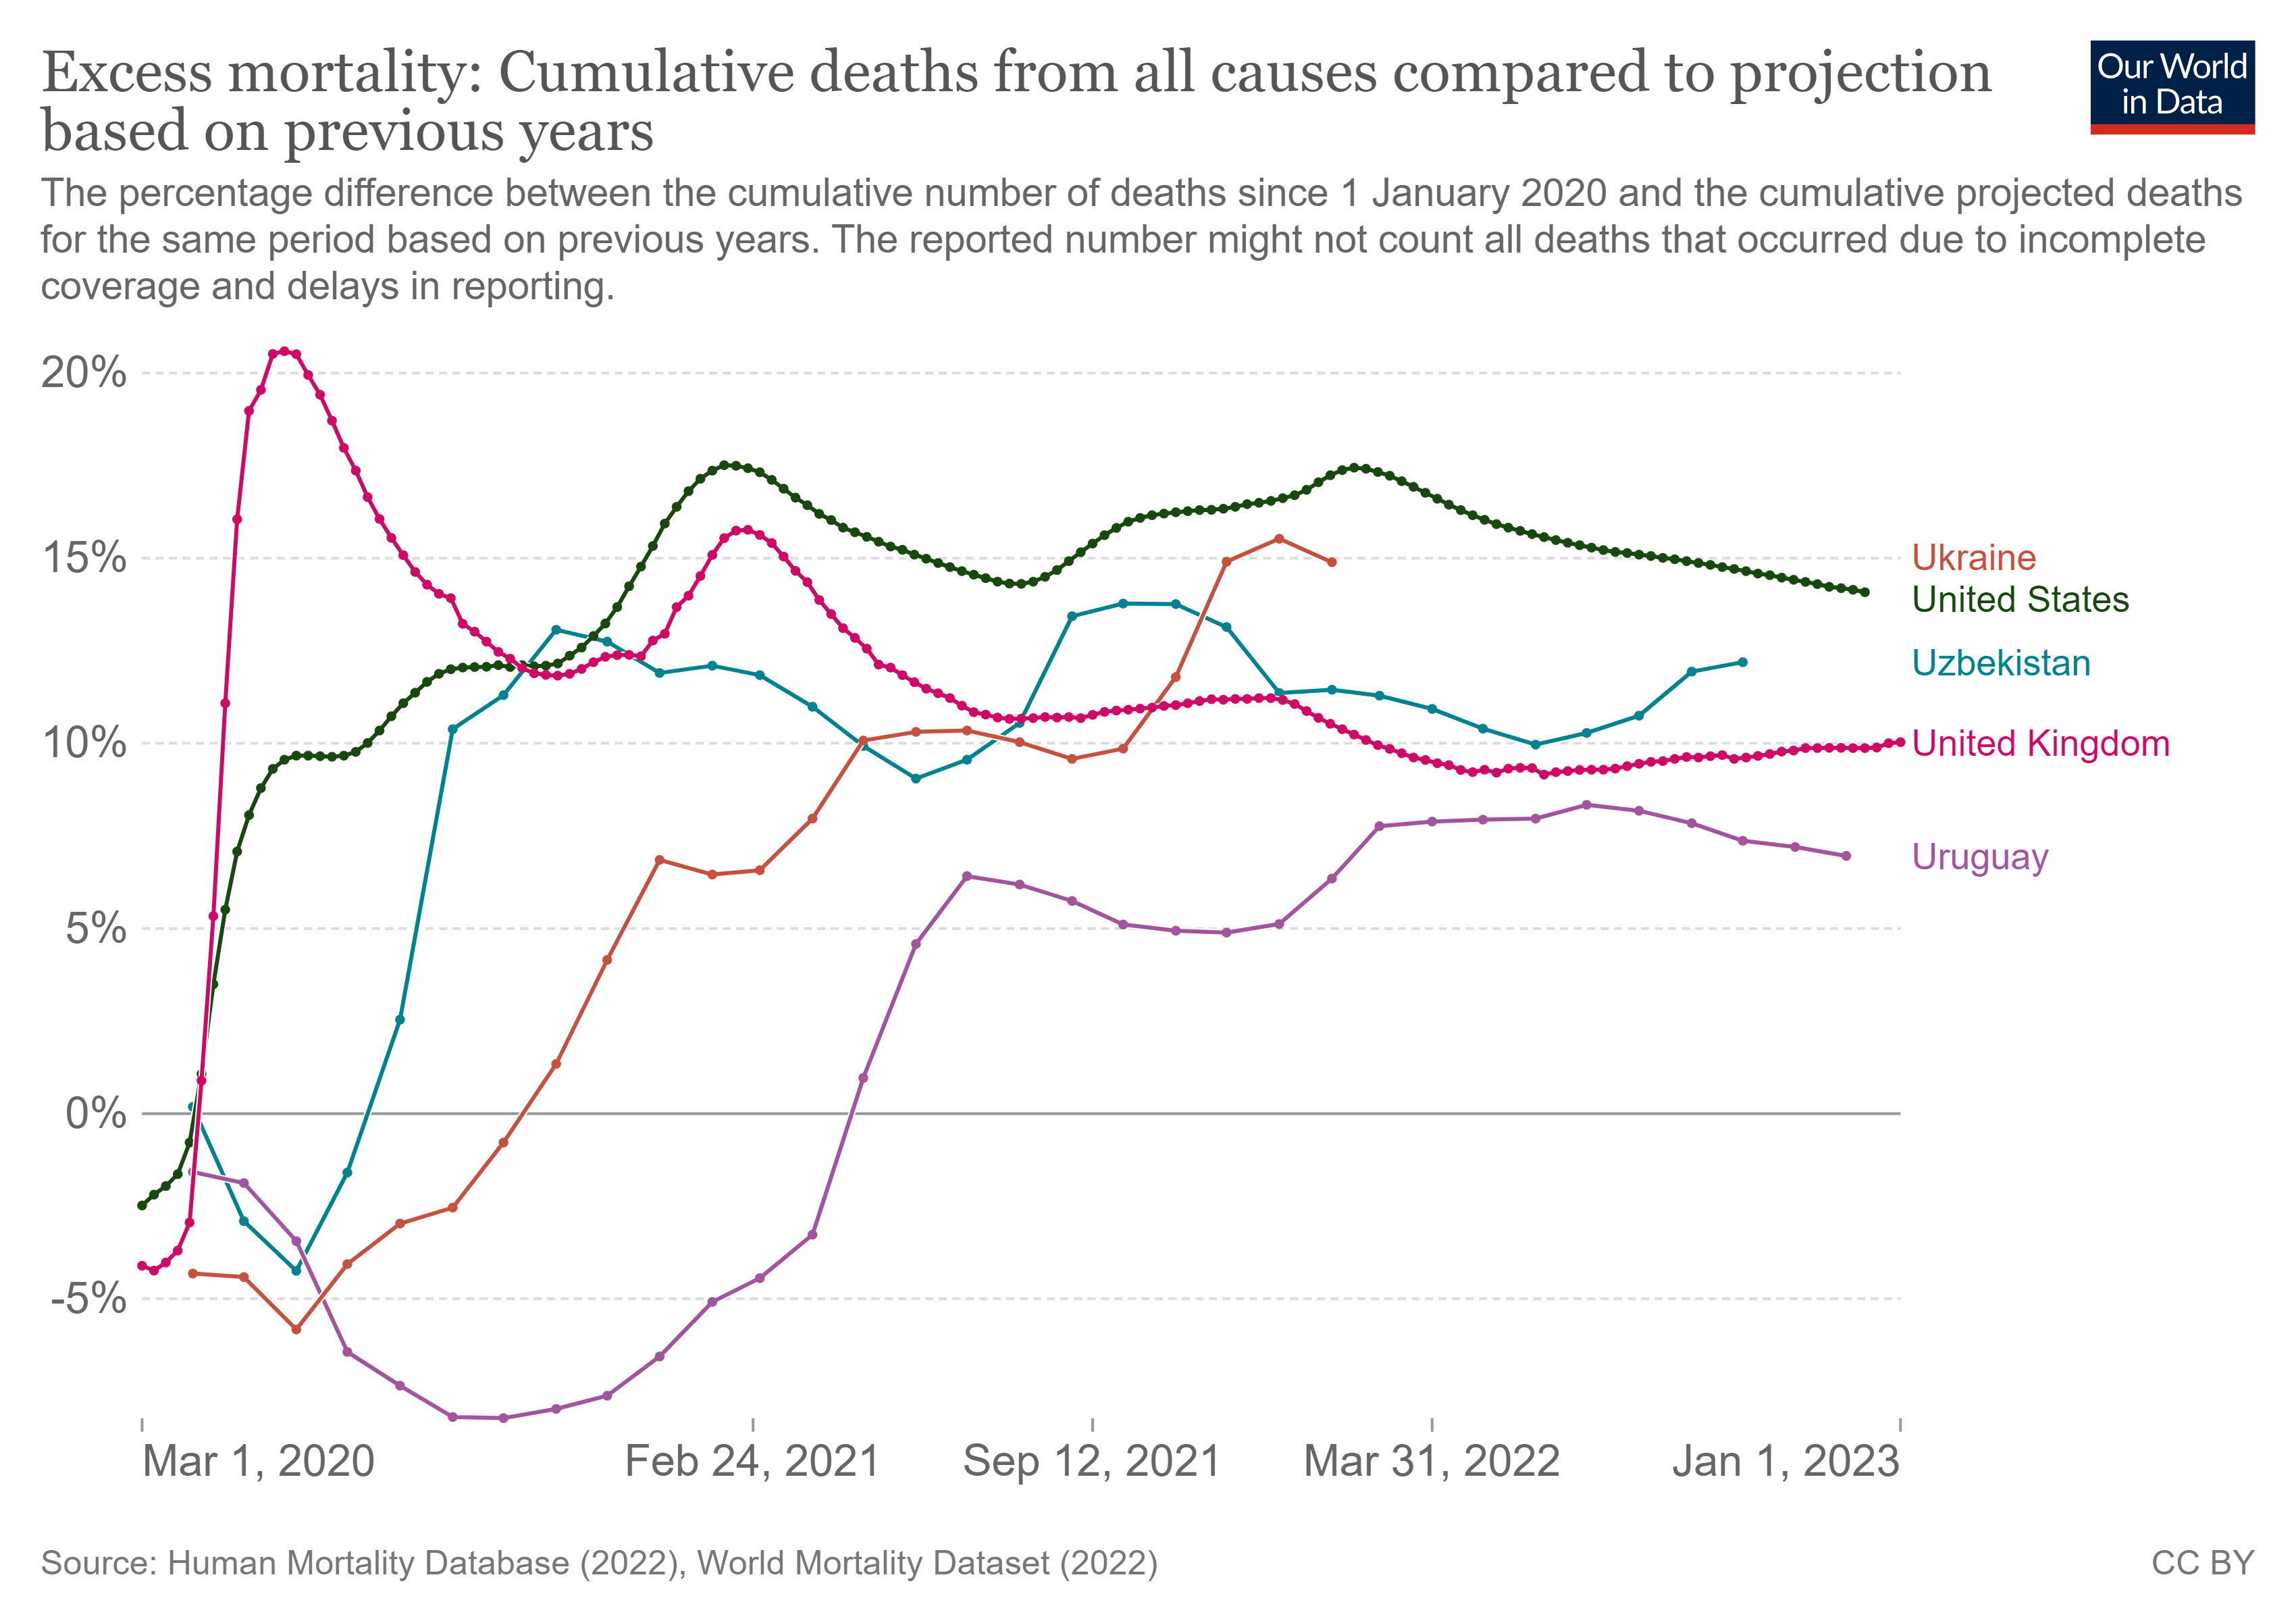
The cumulative excess mortality for these countries through January 1 of 2023 looks to be between 7% and 15%. Ukraine spiked above 15% but then stopped collecting data in February of 2022. I heard some news about a war or something. I see a super midzalom induced kill off in the UK around March and April of 2020 as per John O’ Looney and the vaccine rollout in the USA seemed to really leapfrog the excess mortality above 15%
Uruguay had negative excess mortality through the early days of the pandemic, but once the jabs rolled out around March 1, 2021, it really started lifting off. It is still the lowest on the chart at only 7% above baseline. All the Stan countries have a Russia hangover and are above 10%. The worst I’ve seen globally as of the end of 2022 were Kuwait and Peru, both hovering above 40% total excess mortality. The only countries above the line for cumulative excess deaths were so small they added nothing to the pooled population. There’s a lot of death in the world lately.
Murdering the world is hard, apparently. But they are doing a bangup job so far! So what about the birth data?
According to Sasha Latypova,
“During 2022 births per 100,000 women 18-45 yo in Sweden have declined progressively, reaching the lowest levels -12.7% and -11.5% in October and November, respectively. For the year, the average was -8.6% compared to same period in 2020-2021. Swedish birth rates have followed a declining trend over the last century. Exceptional negative or positive changes (plus or minus 6% over the birth rate from the preceding year) have occurred, for example following the significant peak in the 1920s and after baby booms in the 1940s, 1960s and 1990s. Except for 1922, however, there has never been such a sharp decline in birth rate over a single year as occurred in 2022.”
So there are pretty big decreases in births and increases in deaths. Nobody knows when they end because unlike normal times there is no known end in sight. It is all unprecedented in some ways.
I looked at Mr. Jan’s charts again and realized in his analysis he was using a cumulative function in a weird way. Now this has long been used in birth demographic charts, say. The simple idea behind it is that if I have 2 babies, and then my 2 babies have four babies, then their four babies have 16 babies, then their 16 babies have 256 babies and so on, then the world is going to end because there are too many people!
But as I was telling my own daughter there is not precedent for using a step function in an excess mortality chart. Mr. Jan’s numbers of 62 million deaths globally are low for 2022, actually, as Google says total mortality was around 67 million. Regardless of this there is no reason why 67 million people this year would snowball into 80 million next year, say and 120 million the year after. Or would they?
I present you deaths in threes as a starting appetizer. It’s a storytime with Amy special and all.
I remember the last time I talked face to face with my aunt Sharon in the summer of 2012. She was my favorite aunt and I had spent my summers growing up in her house in Solana Beach, California, and later in Oceanside. She had started her own business as a real estate consultant which I and many other family members worked for at times. She had no children and I was the only surviving girl in the family.
We had a falling out after I broke up with the father of my older daughter and I went back to Thailand. Aunt Sharon did not approve. She thought I was the Worst Mother in the World, something I would totally trademark except it has to be so common to say that. So anyways I got pregnant and married Oh, my first Thai husband. Her husband Bruce (Also her first cousin) hid in the room.
I was six months pregnant and was with my older daughter and I had come to Oceanside to pick up this Nissan Sentra car that had been owned by my grandparents. My parents were caring for my grandmother then and needed the car to drive. I hadn’t seen Aunt Sharon in a few years. She loved seeing my older daughter, but smoked cigarettes obsessively around me. She hadn’t wanted to talk to me the whole time I was there. Finally she spoke:
“You know Bruce he really can’t stand being around Asians. You remember how he was with the Phillipino nurses when he was in the VA hospital?” My aunt questioned me. I had been asking her if Uncle Bruce wanted to come out for a last picture together or something before we left. Apparently not. Aunt Sharon continued.
“Look I know you are trying to make your Thai husband a visa.” She said. My first husband Oh had not been allowed to come to the USA on a tourist visa because he was married to me. So obviously he wasn’t there in Oceanside with me as he couldn’t be there. I rubbed my 5 month pregnant belly.
“If you bring your husband to America,” my favorite aunt warned. “I don’t want to see him. I don’t want to see you with him.”
Aunt Sharon looked down at my pregnant belly, with what is now my 10 year old daughter. “And I’m pretty sure I don’t want to meet the baby either.”
These are not great last words for me to remember, favorite aunt of all time. It has to go in my accounting somewhere.
I understand the phenomena of death in threes quite well. It happened in my family in 2014, 2016, and 2018. This is a small family I’m going to say half died in those three years on my father’s side.
Aunt Sharon began it all with her death on January 25, 2014, around the time my husband Oh was conducting his visa interview at the US Embassy in Bangkok. She had been in the hospital for over 6 weeks due to complications from her COPD. She’d been in an oxygen tent since December 14 or so. She was supposed to be getting out of it and going home and then she crashed. Her heart gave out from all of the excess oxygen.
Aunt Sharon supposedly wanted no funeral and no memorial. There should be no acknowledgment that she had died, even, at least according to the guarded words of her husband Bruce. Her business was sold off quietly even though she had trained many people myself included in the details of running it (You really need an upgrade out of Saas Aunt Sharon!). My father insisted on seeing her ashes in Oceanside and paying respects despite Uncle Bruce’s objections.
I wrote an obituary on Facebook whether she liked it or not.
My father died next. He had watched his sister’s excruciating hospital endeavor. He was not a smoker but he had had asthma since childhood and he had COPD for many years. He wanted to go out at home warm in his bed. He said that so many times. He knew enough and was a strong man.
And on and on it went. By 2019 I had about lost my mind. In April of that year Mar, my mother in law, died from complications of a brain hemorrhage. Then in July of 2019 Uncle Bruce died of a bowel obstruction. The hospital had looked long and hard to find my brother Andy as his closest relative, as they had visited him a few years prior and there were some pictures on facebook. Obviously I couldn’t go to the Oceanside house with my husband and children with them.
By December of 2019 I was basically waiting for the third death. The whole family was sick in November of 2019 and I freaked out at every turn. My husband with his epilepsy and living alone did not answer his phone for about three days in December of 2019. I was terrified that he was dead, but then he turned up at Kuhn Wii’s motorbike shop claiming his phone had been left in the rain and didn’t work and needing money for a new one. Ugh. But still alive.
The fact that 2019 did not end with a third death was cause for celebration for me. On New Year’s morning of January 1, 2020, I ran on Naithong Beach and contemplated the new decade. It was so open and life had never felt better!
Really though these charts boils down to perception. Are we just hackable animals, as Yuval Harrari put it, easily exploited and manipulated through psychological loopholes and shortcuts? Are we just base creatures that only need to respond to our base desires? Are we just left responding to whatever crappy hand fate dealt us?
Or is there something dynamic and accountable and unique about each of us conscious beings? Something which adapt to changing circumstances and which introduces new ideas and insights which contribute to the enrichment of humanity as a whole? Is a child just another mouth to feed in a resource depleted world, a sign of irresponsible parents to even bring into the world? Or is a child a gift from God who might one day find the cure for cancer?
These questions impact the human race.
The cabal must be creaming their jeans over these graphs. They hate all of humanity and want us all dead ASAP.
Good stuff!